Blog
Reading the Cluster at a Glance with Yale SLURM Utils
A small command-line tool that turns dense SLURM output into a readable, live dashboard — and why that matters when you share a supercomputer to train and run large language models.
Most of my machine learning work at Yale does not happen on my laptop. It happens on a shared supercomputer, and the single most common question I ask during the day is deceptively simple: what is free right now? I built Yale SLURM Utils to answer that question in one short command, with output I can actually read.
Before getting to the tool, it helps to explain the world it lives in, because the jargon around high performance computing can be a wall if you have never worked inside it.
What is an HPC cluster?
A high performance computing (HPC) cluster is, in plain terms, a large collection of powerful computers wired together and shared by many people. Instead of one machine sitting under your desk, you have hundreds of machines (called nodes) sitting in a data center. Some of those nodes have graphics cards (GPUs), which are the engines that make training and running large language models practical.
You do not get the whole cluster to yourself. Dozens or hundreds of researchers want those same GPUs at the same time. So a cluster needs a traffic controller that decides who gets which hardware, for how long, and in what order. That traffic controller is a job scheduler.
At Yale I mainly use a cluster called Bouchet for general machine learning work, and a separate cluster called Hopper for projects that involve personally identifiable information. Bouchet is where we train and run our models, and it is the cluster these examples come from.
What is SLURM?
SLURM (Simple Linux Utility for Resource Management) is the scheduler that runs on Bouchet and on a huge share of the world’s research clusters. You do not run your program directly. Instead, you write a small script that describes what you need — say, one H200 GPU for six hours — and you hand that script to SLURM with a command called sbatch. SLURM puts your request in a queue, and when the hardware you asked for becomes available, it runs your job.
SLURM ships with a couple of tools for inspecting the system:
sinfotells you the state of the nodes and partitions.squeuetells you what jobs are queued and running.
These tools work, but their raw output is a dense wall of whitespace-separated text. Figuring out “are there any H200 GPUs free, and if not, who is using them all?” means squinting at columns and doing arithmetic in your head. Several times a day. That friction is exactly what I wanted to remove.
Partitions, and why they matter
Before I show the tool, there is one more concept worth understanding: partitions.
A partition is a named group of nodes, usually carved up by the kind of hardware they contain or the rules that govern them. On a modern GPU cluster you might have one partition full of h200 cards, another with b200 cards, others with rtx_pro_6000_blackwell, rtx_5000_ada, or l40s GPUs, and so on. Different GPUs have different amounts of memory and different speeds, and they are requested at different rates.
This matters enormously in practice. If the h200 partition is completely full, my job might sit in the queue for hours. But a smaller model might run perfectly well on an l40s partition that happens to be wide open right now. Knowing which partition has free capacity is often the difference between starting a training run immediately and waiting until tomorrow morning. The whole game is matching the work you have to the hardware that is actually available.
Enter Rich
The tool is written in Python and built on top of Rich, a library for producing genuinely beautiful terminal output. Rich does the heavy lifting of drawing tables, coloring text, rendering progress bars, and refreshing a live display in place without flicker.
This is the quiet hero of the project. SLURM already knows everything I want to know — it just reports it as plain text. Rich lets me take that same information and present it as bordered tables, color-coded states (green for free, red for busy), utilization bars, and a full-screen dashboard that updates on a timer. The data is the same; the readability is night and day.
ysu: the cluster at a glance
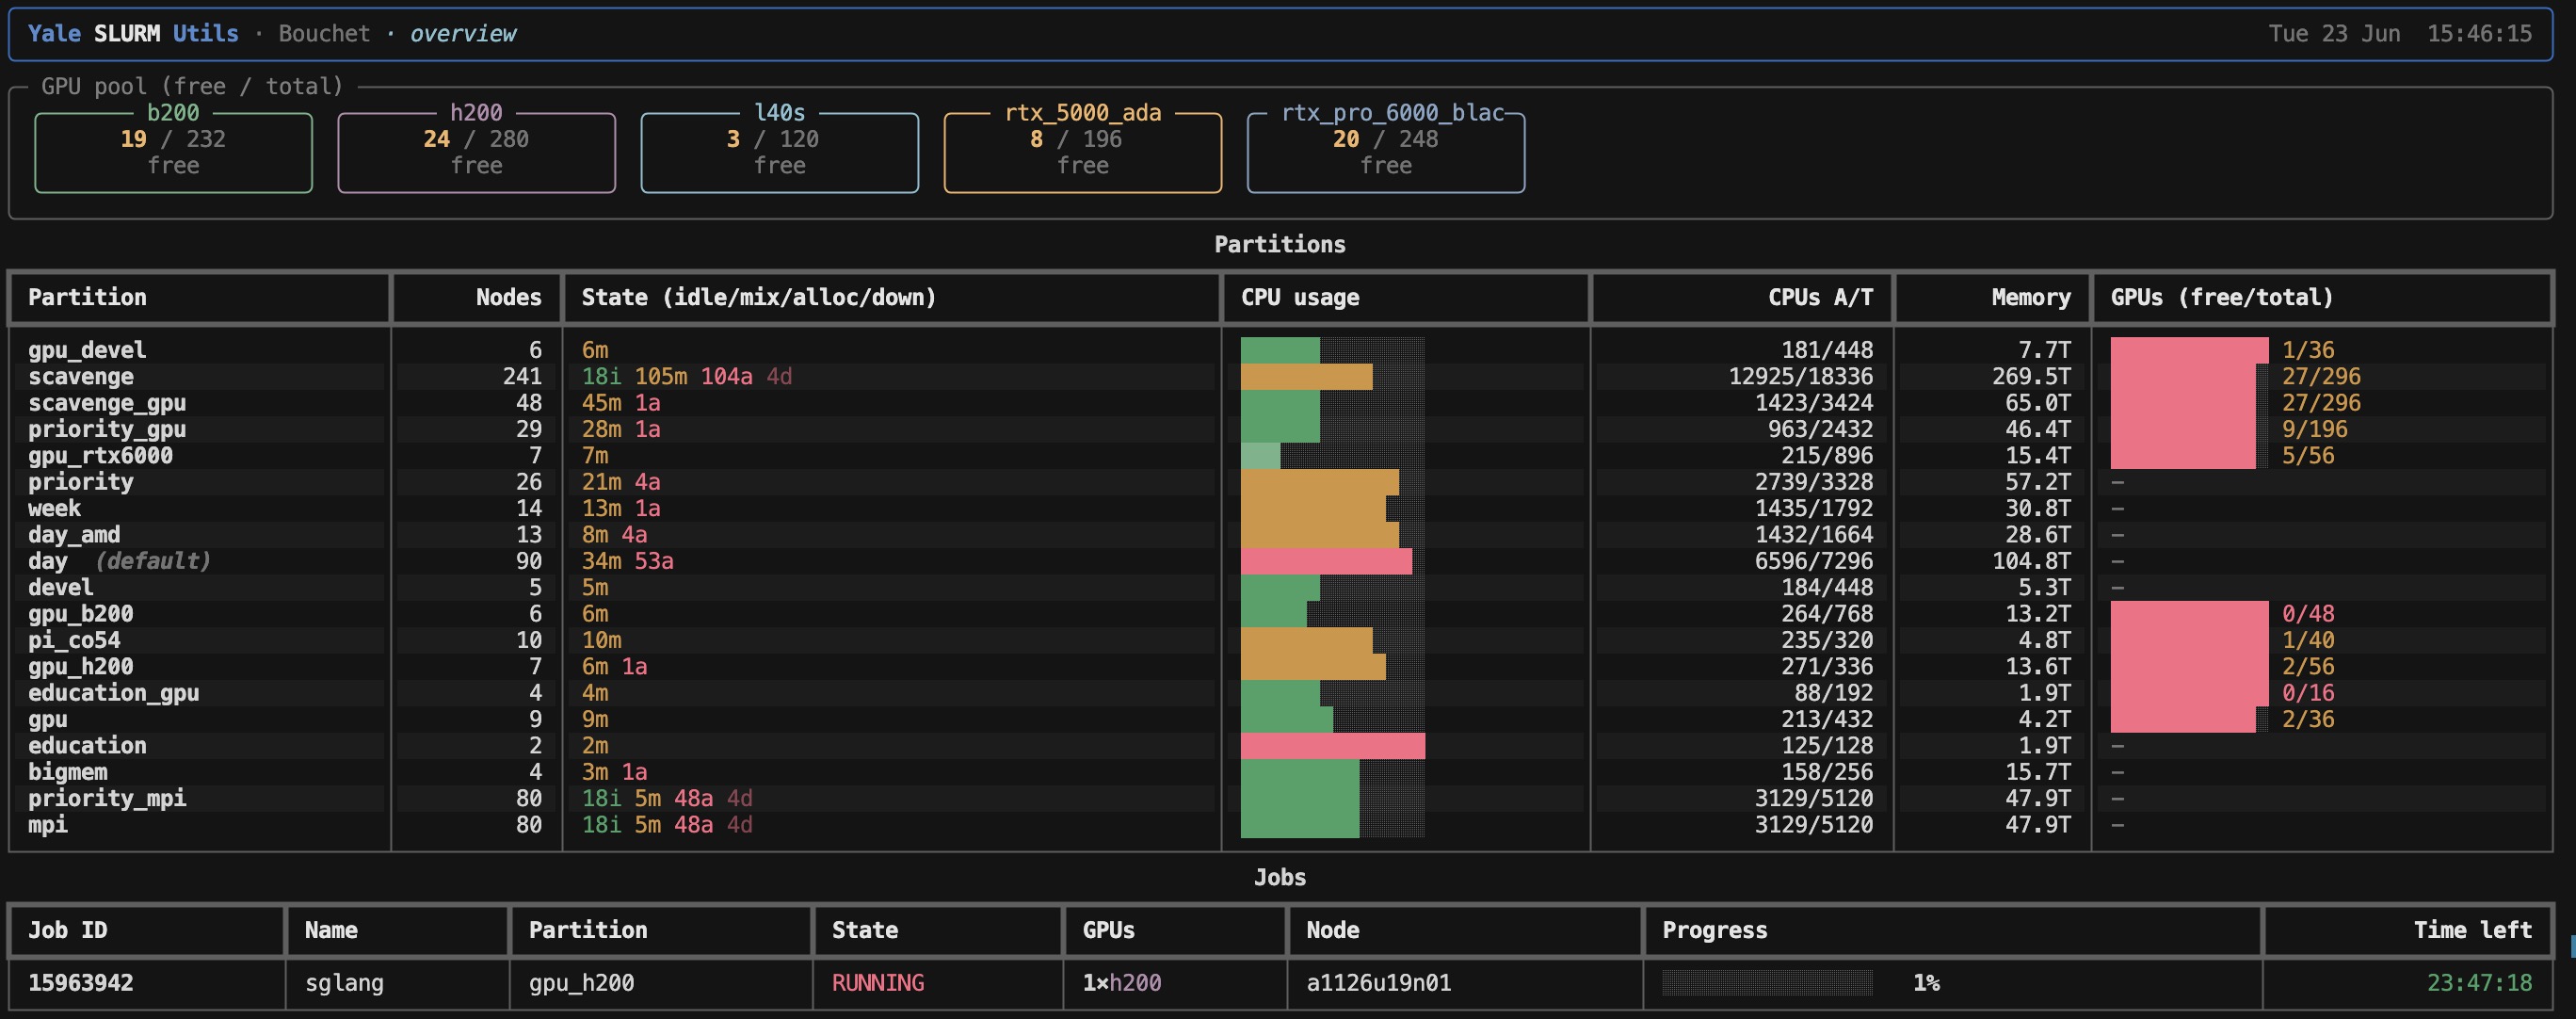
The main command is ysu. Run it on its own and you get a quick overview of GPUs, partitions, and your own jobs in one screen — the dashboard shown at the top of this post.
When I want to focus specifically on GPUs, I run ysu gpus, which breaks availability down per partition and per GPU model.
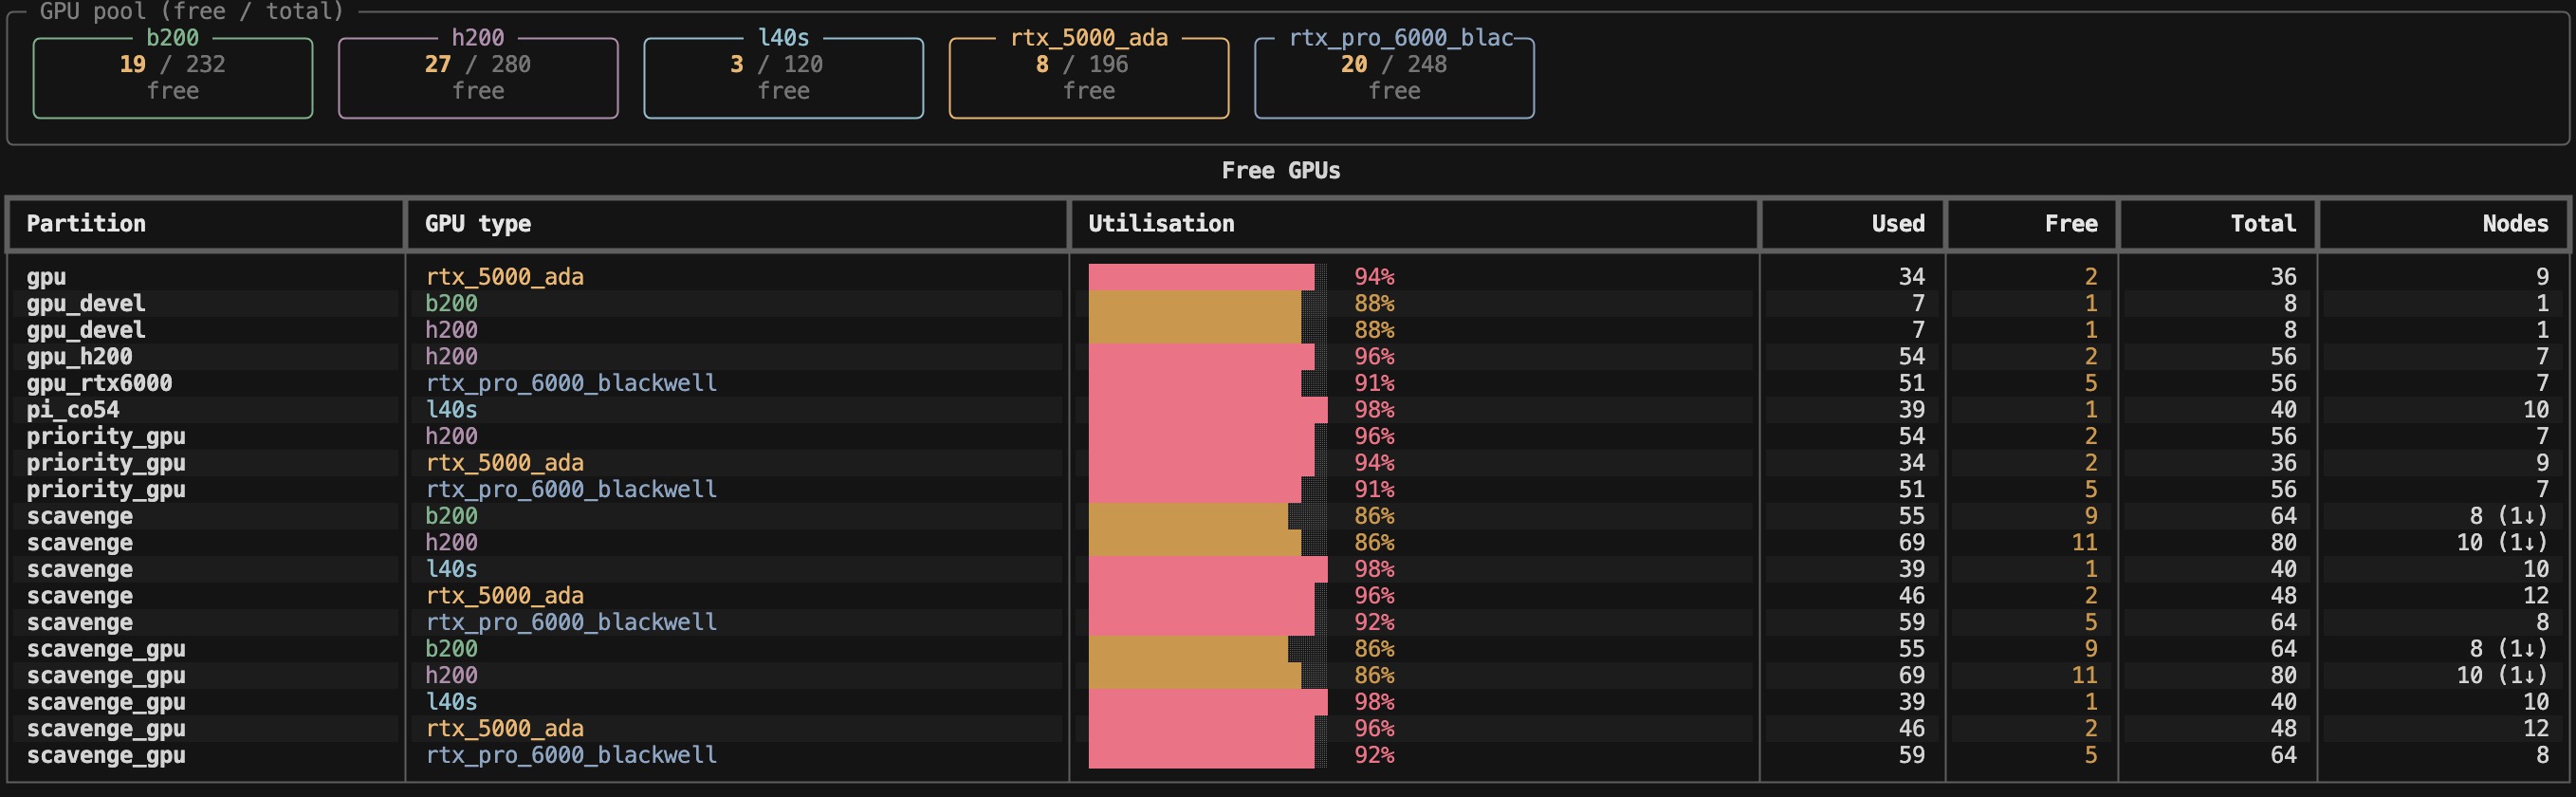
ysu gpus shows free and total GPUs per partition and per model, so you can see at a glance where there is room to run.A few flags make this even sharper:
ysu gpus --freehides everything that is fully allocated and shows only what I can actually grab right now.ysu gpus --usersturns it into a leaderboard of who is consuming the most GPUs, with my own row highlighted — useful for understanding why a partition is full.ysu freeis a shortcut straight to available GPUs.- The
--partition/-pflag works on every command, soysu gpus -p gpu_h200narrows everything to a single partition.
The ysu partitions command zooms out to the node level, showing node states, CPU utilization bars, memory, and GPU free/total at a glance, while ysu list-partitions just prints the partition names when that is all I need.
Keeping an eye on my own jobs
Once a job is running, ysu jobs becomes the command I live in. For each of my jobs it shows the GPUs allocated, the working directory the job was submitted from, the log files (StdOut and StdErr), the command itself, and — crucially — the time left before SLURM reclaims the hardware. On a busy cluster, knowing exactly when a six-hour reservation expires is the difference between checkpointing in time and losing progress.
The feature I reach for most is ysu watch. It launches a full-screen live dashboard that polls SLURM on an interval, rings the terminal bell when one of my jobs starts or finishes, and keeps a timestamped event log. I can kick off a fine-tuning run, switch to other work, and let the terminal tap me on the shoulder the moment my job leaves the queue and starts running, or the moment it completes. Pair it with a partition filter and an interval, like ysu watch --partition gpu_h200 --interval 5, and you have a focused monitor for exactly the hardware you care about. ysu log keeps the persistent history of those events around for later.
How this fits our LLM work on Bouchet
This is not a tool I built for fun in the abstract. It came directly out of how my team trains and runs large language models on Bouchet.
When we parsed 3.6 million historical names, we fine-tuned a family of small Qwen models for three epochs on H200 GPUs, then ran inference across millions of records. That kind of work is a constant negotiation with the scheduler: claim H200s for a training run, watch for them to free up, monitor the job’s time budget, and then queue a long inference sweep afterward. Doing that blind — by squinting at squeue over and over — is miserable. Being able to type ysu and instantly see whether the H200 partition has room, who is using it, and how much time my current job has left, turns a recurring source of friction into a glance.
That is really the whole pitch. A utility like this does not give you any capability you did not already have; SLURM was always going to tell you these things. What it gives you is legibility. When you share an expensive, oversubscribed machine with a crowd of other researchers, the faster you can read the state of the cluster, the better the decisions you make about where to run your work.
Trying it out
Installation is designed to be painless on a cluster. The repository ships an install.sh script that is self-locating (you can run it from any directory), builds the package into its own isolated environment via uv tool install, and makes sure ~/.local/bin is on your PATH. If you would rather not install it system-wide, you can run it ad hoc with uv run ysu. All it needs is Python 3.10 or newer and the standard SLURM client tools (sinfo and squeue) on your path — which any SLURM cluster already has.
The code is open source and MIT licensed. If you work on a SLURM cluster — at Yale or anywhere else — you can find it on GitHub.